

Guitar speakers are like car tires. They all function basically the same way, but small differences in materials and design can produce noticeably large differences in performance. Given the wide range of currently available speaker choices and consumers’ insatiable appetite for information, most speaker manufacturers offer graphical models of their products to help us navigate the options. So what do these graphs tell us and how useful are they in helping plan our next speaker purchase? To answer these questions, let’s look at how those graphs are created and what they really say.
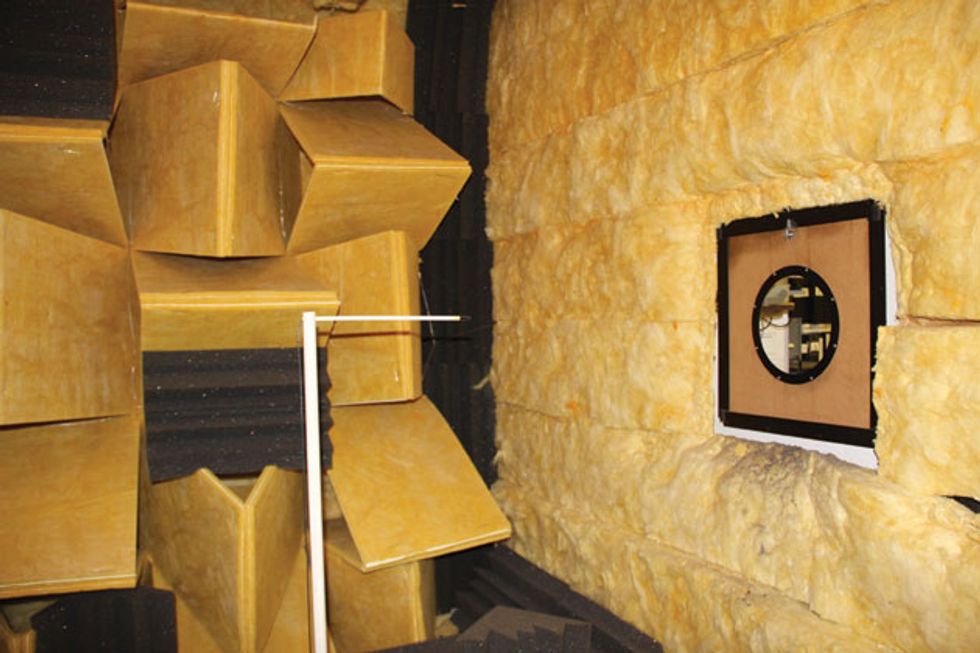
Here’s how my good friend, Eminence’s Anthony Lucas, explains the graphing process: “To plot speaker response, the speaker is mounted on a baffle that is open on the back and facing an anechoic chamber in front. This ‘infinite baffle’ configuration ensures minimum environmental coloration of the speaker under test. The speaker is driven by a solid-state power amp fed by a frequency sweep generator with a microphone placed one meter away from the center of the cone. The microphone is specially designed for this test and is connected to a software-based measurement system. To eliminate distortion artifacts from the test results, the solid-state power amp is chosen for extremely low distortion and high linearity. The speaker is driven at 1 watt to minimize external reflections and mechanical distortion. A final step in this process involves a ‘correction file.’ This is a compensation filter that prevents any remaining room artifacts, known as room signature, from impacting the results.”
This test simply measures frequency response (and sometimes a speaker’s corresponding impedance curve, a subject we’ll explore later) in an idealized environment, so the test power amp is important. When comparing two different manufacturers’ speaker graphs, we assume that different speakers are tested under similar conditions to assure a realistic comparison. Makes sense, right? Sure, as long as all manufacturers use the same procedure. Which begs the question: Do they? Theoretically yes, assuming they use similar equipment and test environments. In reality, there are procedural and technical variations from manufacturer to manufacturer. Absent a rock-solid baseline, that makes the comparison somewhat subjective. This sounds discouraging until you consider that what happens to a guitar speaker in a tube amplifier makes much of this testing precision seem rather moot.
A solid-state power amp is going to depart in performance from a tube power amp in a couple of important ways that turn out to be crucial in choosing a speaker for a particular tube amplifier. First, as explained above, a solid-state amp is relatively distortion free, and secondly, its low effective output impedance reduces its interaction with the behavior of the speaker.
Most players assume that power tubes have a unique “sound” that’s largely responsible for the sound of their amplifier. This is one of two common myths about tube amps. If that were true, how then do you explain all the “linear” hi-fi tube amps of the ’50s and ’60s? The simple fact is, tubes are generally neutral regardless of type, with the most obvious differences in behavior being attributable to their operating environment—meaning the circuit design, operating voltages, and transformer designs associated with them.
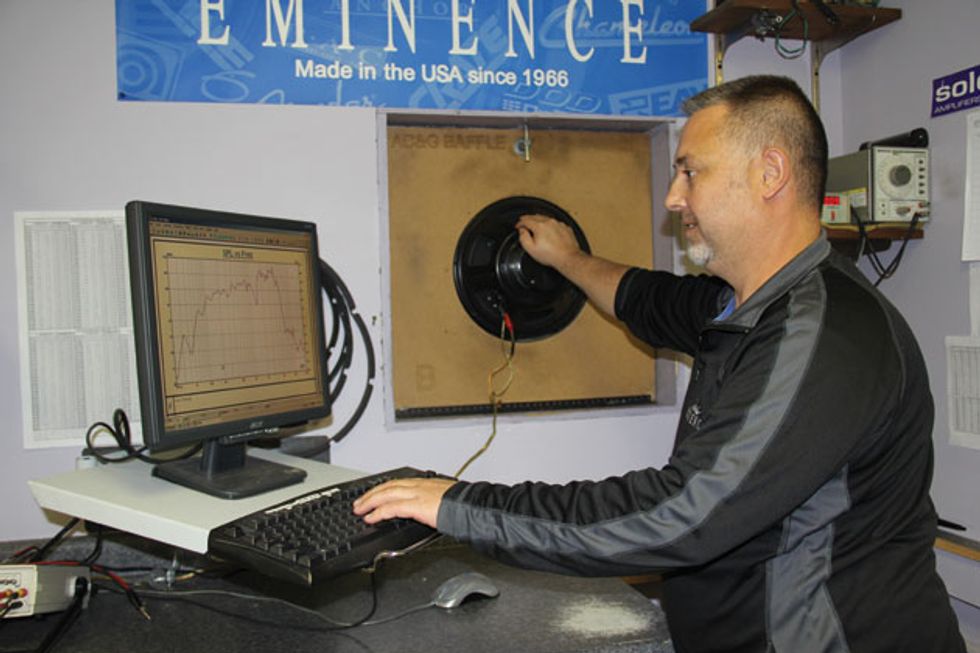
Eminence’s Anthony Lucas generating a SPL (sound pressure level) versus frequency graph. Image courtesy of Eminence
The second myth is that tube amp sound is due to special added distortion. The fact is that any amplifier can be induced to add distortion of one kind or another. The question is, what kind and how much? I’ll cover this in more detail in an upcoming column, but here’s what we need to know right now: How you operate a power amp determines how much distortion it produces, and in this respect distortion can be set aside for the purposes of our discussion.
When discussing speaker behavior, the most important difference between solid-state and tube power amps is source (output) impedance. Our solid-state amp, having a very low effective output impedance, will force a speaker to behave in a more linear fashion. Conversely, a tube power amp exhibits a much higher output impedance, and this allows the speaker to influence the behavior of the power amp. In other words, the solid-state power amp will restrain speaker behavior, producing a flatter graphical profile, while a tube power amp and speaker form a system in which each is an integral part of the sonic result we all know and love.
In addition, the special reactive relationship between the speaker and tube power amp is influenced by the size, shape, and resonance of the speaker cabinet itself. At this point it should be apparent that the test environment described above seeks to eliminate that resonant reactive behavior. So now is a good time to ask: How helpful is a graph of speaker performance stripped entirely of its normal operating environment in making an informed speaker choice? The answer: It depends.
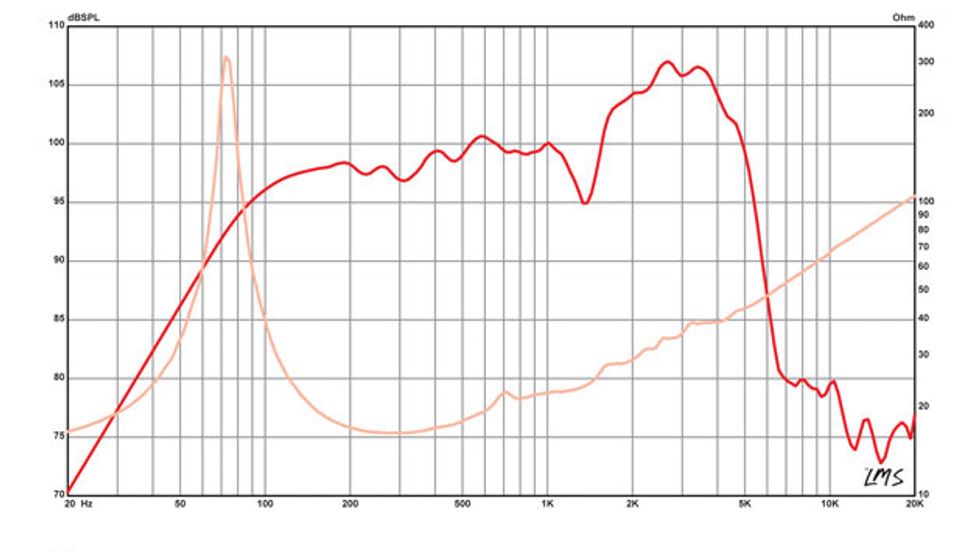
This graph shows the frequency response of Eminence’s EJ-1240, the company’s 40-watt Eric Johnson signature alnico 12". The red line represents frequency response and the tan line indicates the speaker’s corresponding impedance curve. Image courtesy of Eminence
It may surprise you to learn that many amplifier manufacturers don’t put a lot of initial stock in these graphs when deciding which speaker to use for a given amp design. While they’re very useful in making a final decision between two candidates with very similar signatures, the real work takes place long before we ever get to the nitpicking graph comparison stage. That means we, the amp manufacturers, have made the most critical decisions about sound, application, and overall performance much earlier than that. Once we get close to final production design, we may pay a little more attention to the graphs to fine-tune the amp/speaker/cab relationship in ways that the player would be wise to think about before replacing the stock speaker with another unit.
What a speaker graph shows is that most guitar speakers perform similarly on paper, and all bets are off when you install them in your amplifier. With that in mind, the first step in making a speaker purchase should be to establish your desired outcome. Then look at the manufacturer’s recommendations about the models you feel line up with your goals and fit your budget. Forums can be a valuable resource, but try to avoid getting into the weeds when soliciting opinions online by carefully vetting responses that address your specific application.
After you’ve narrowed your search, it’s time to have a look at those graphs. Pay particular attention to the more prominent peaks they reveal. Those are the areas that are most subject to operational variables like output impedance and cabinet resonance. The higher the impedance, the greater the impact those peaks will have on your amplifier’s performance and, consequently, the more they will drive cab resonance. And since internal feedback (more on this in a future column), as found in most power amp designs, plays a role in output impedance. A power amp designed with low or no feedback—such as in AC30-style amps—will exhibit higher effective output impedance and further exaggerate those curvalicious peaks!


![Rig Rundown: The Black Crowes’ Rich Robinson [2026]](https://www.premierguitar.com/media-library/youtube.jpg?id=66952027&width=1245&height=700&quality=70&coordinates=0%2C0%2C0%2C0)